See what's really happening
Simple, visual dashboards with built-in AI insights and recommendations so you can make fast decisions, without manual reports or number crunching.











Knowledge is power
Everything in view
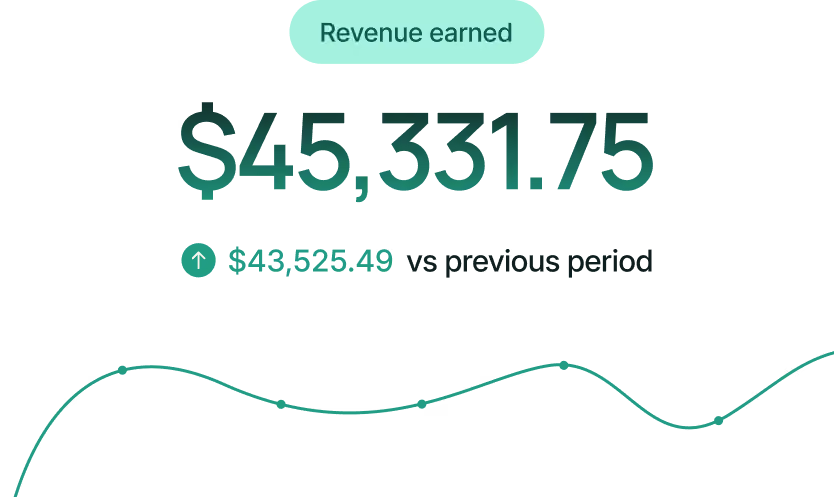
See your revenue, bookings, retention and member activity together in one clear dashboard, so you always understand how your business is performing without exporting data or building spreadsheets.
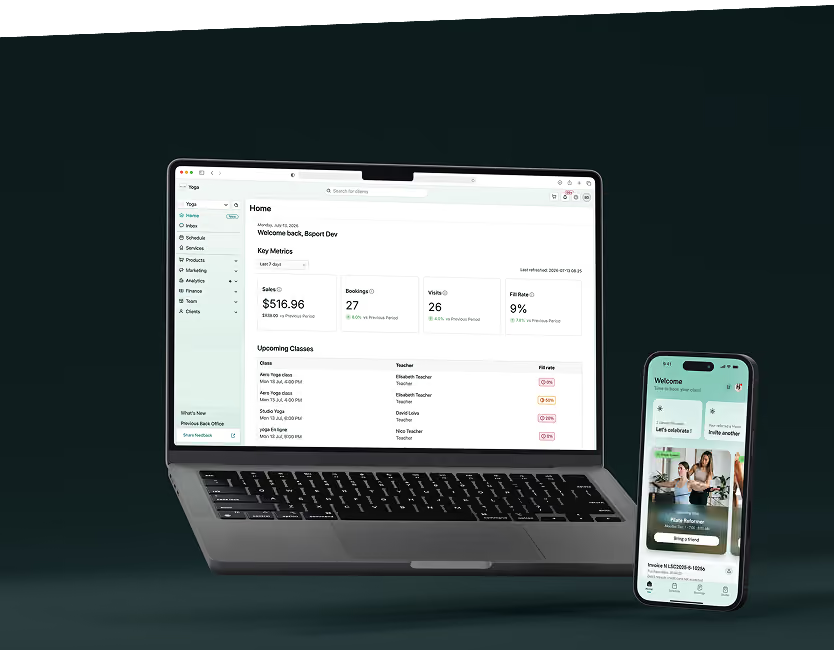
See where revenue is lost
Track memberships, recurring revenue, churn, bookings, attendance, no-shows and booking sources in one place, so you can see exactly where revenue is growing, where it's leaking, and which changes will have the biggest impact.
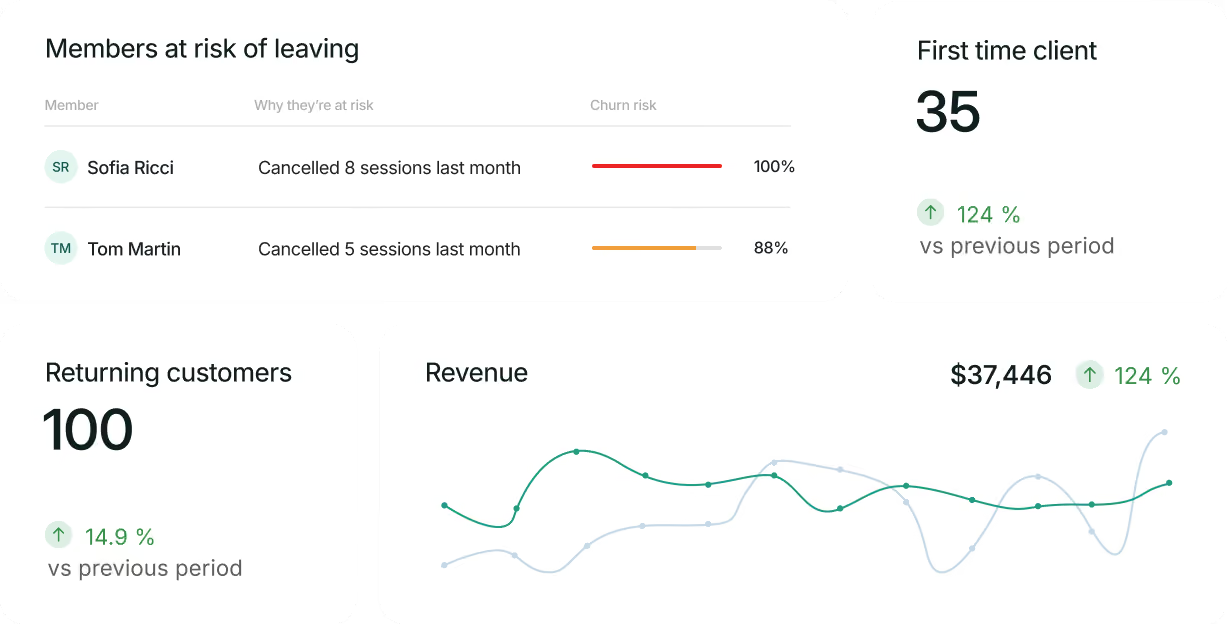
Understand your community
Track the journey from trial to loyal member. See what converts, what encourages repeat visits, and who might not return, with an AI churn risk score that helps you act before members drift away.
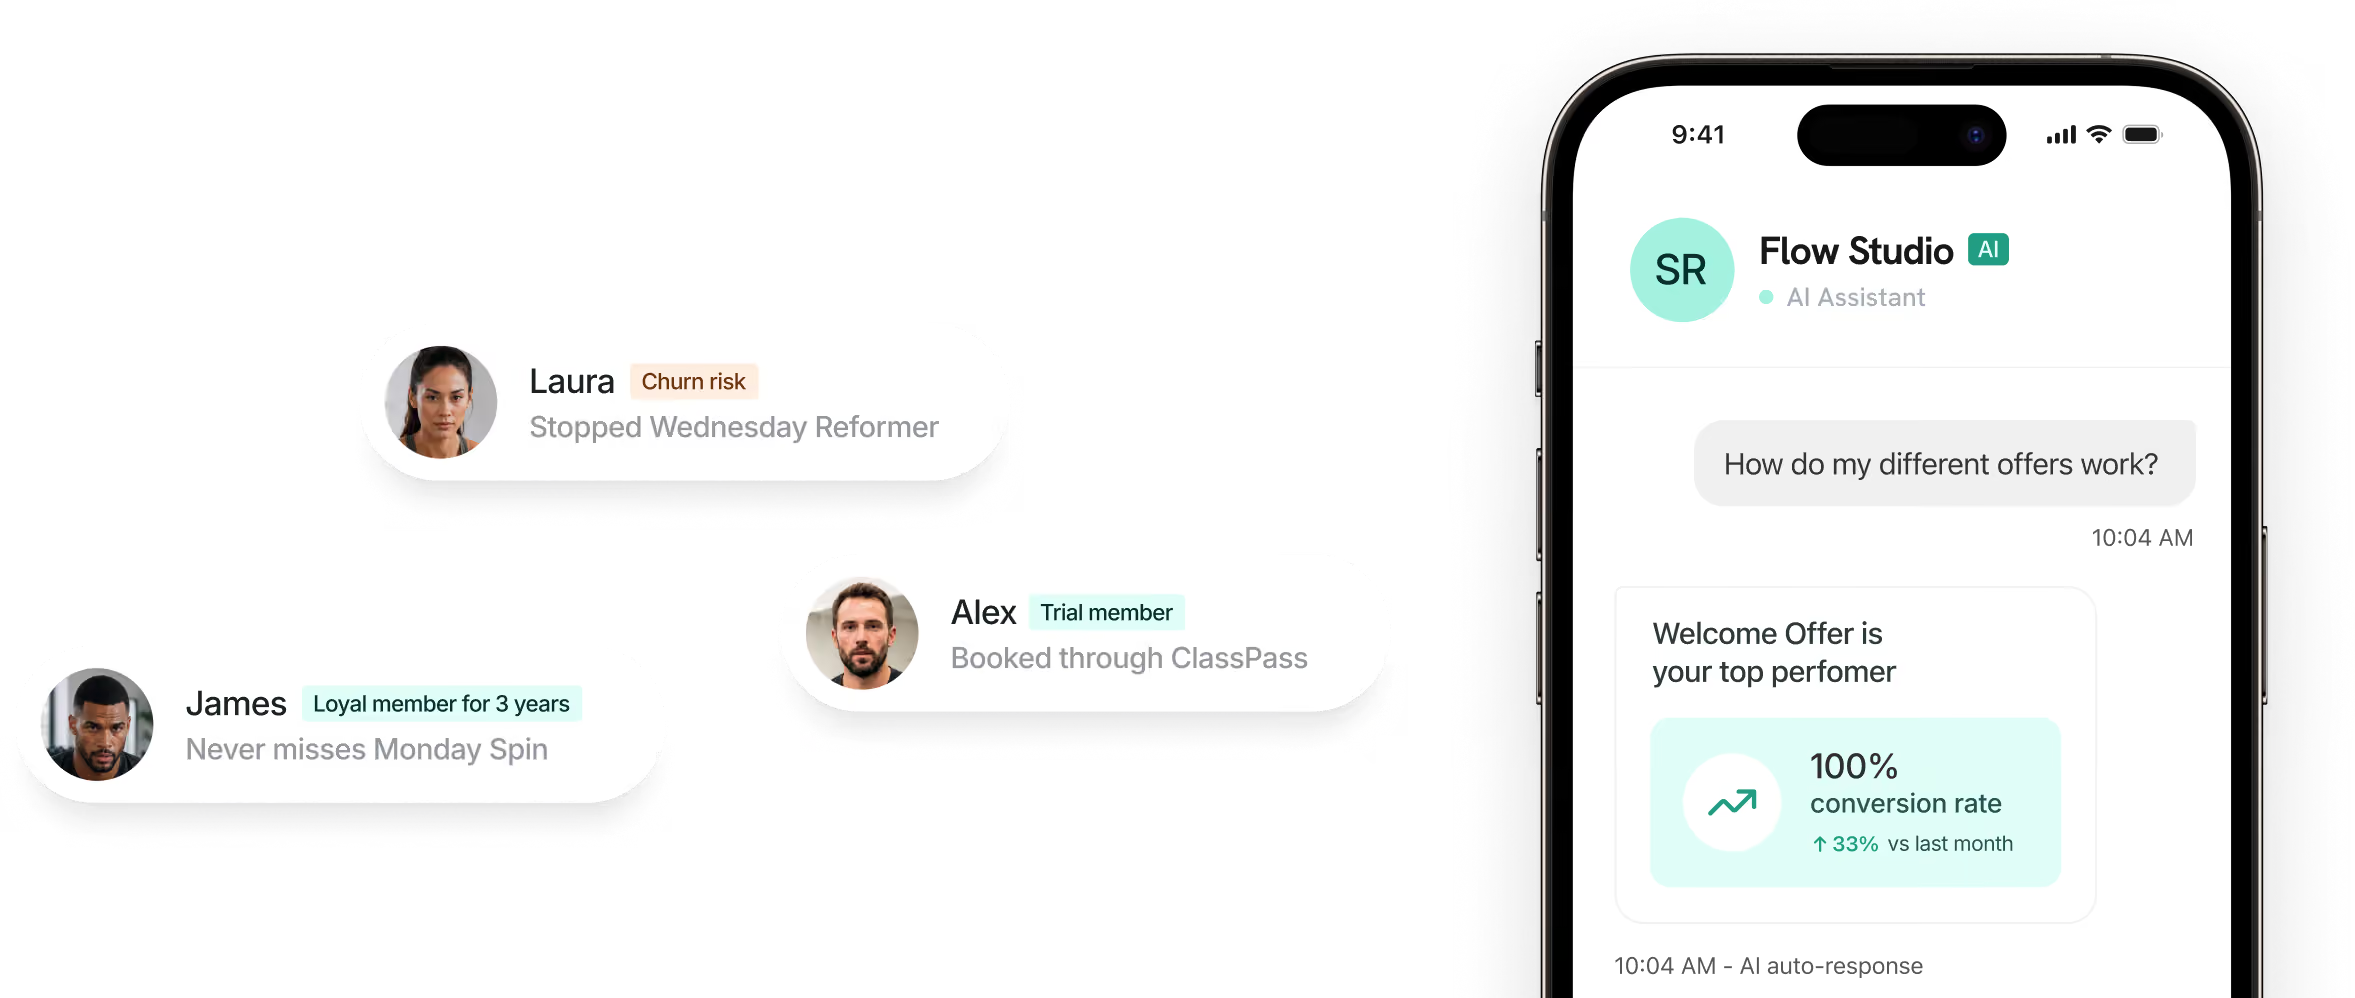
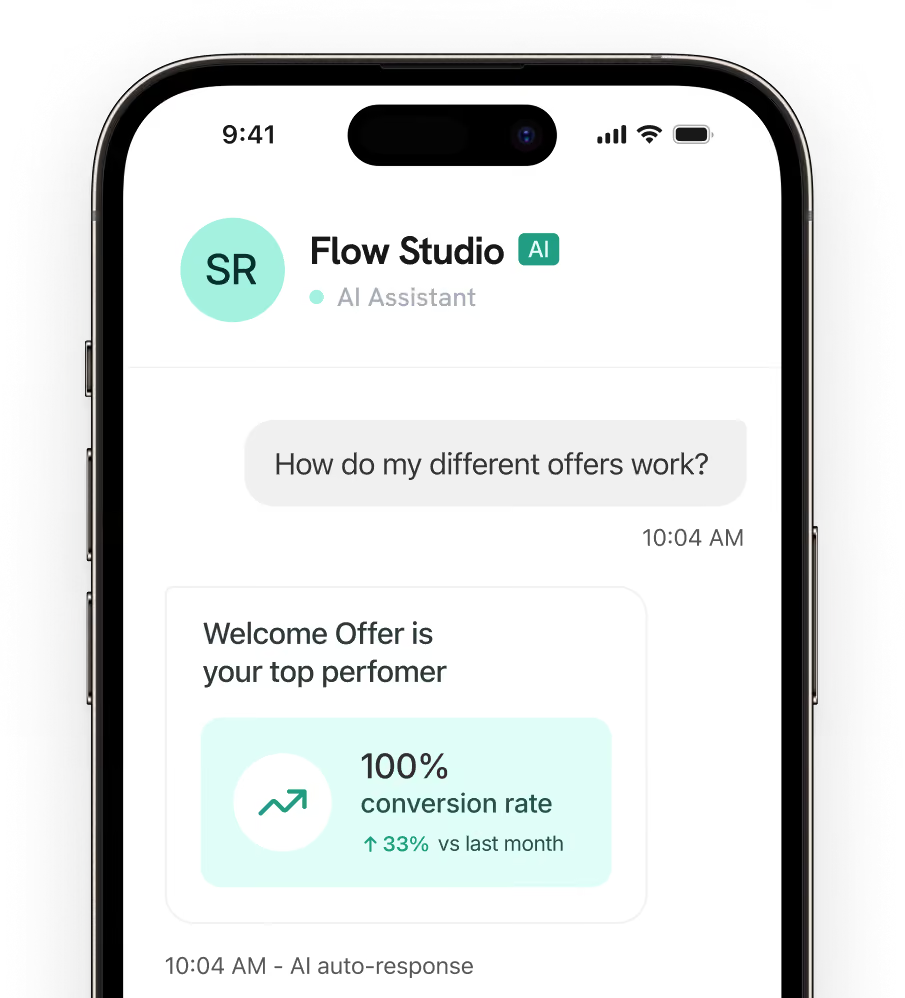
Make informed decisions fast
Pre-built dashboards load fast and, when something needs action, AI suggests the best next step, from checking a drop in attendance to following up with members at risk.
Go deeper when you need to
In addition to at-a-glance dashboards, get secure access to your full datasets through a dedicated data warehouse. Ask deeper questions, connect your own BI tools or look across locations to understand revenue, member behaviour and performance in more detail.
Hear from our customers


Key things to know

No. The dashboards are pre-built. Your data fills them. Revenue trends, booking sources, no-shows, and churn risk are all structured for you. For deeper analysis, you can pull more detailed reports and connect your own BI tools through a dedicated data warehouse.
bsport's AI reads your studio's data and turns it into specific recommendations. It scores every member's churn risk and flags shifts in attendance or bookings, so you know what to look at and what to do next. Every recommendation comes from your studio's own data.
Everything that matters to your business in one place: revenue, bookings, attendance, retention, and where members are dropping off. No exports, no spreadsheets.
